


Read Time:4 Minute, 46 Second
Supply chain costs are often “locked in” by decisions people do not revisit often: where to place warehouses and how to move goods between them. When those choices are off by even a little, the business pays every day through longer transit times, higher fuel spend, excess inventory, and avoidable customer complaints. In India, an DPIIT study estimated logistics costs at 7.97% of GDP, underlining how material these decisions are at a national and company level. Understanding network optimisation is therefore not just an operations topic; it is a practical business capability.
The Real Trade-Off: Transport Cost vs Inventory Cost
Network optimisation is about balancing two cost buckets that pull in opposite directions:
- Transportation:moving goods between plants, warehouses, and customers
- Inventory and warehousing:holding stock closer to customers to deliver faster
The same DPIIT report cites the Council of Supply Chain Management Professionals 2025 State of Logistics breakdown for the US, where transportation is about 63% of total logistics cost and inventory carrying about 30%. These proportions differ by industry and geography, but the message is consistent: transport usually dominates, and inventory is the next heavyweight.
Inventory carrying cost is not just “space rent”. It includes capital cost, insurance, shrinkage, obsolescence, and handling. A commonly cited rule of thumb puts annual carrying cost in the 20–30% range of inventory value, which means “one extra warehouse” can be surprisingly expensive if it forces you to duplicate safety stock. Good optimisation makes these trade-offs visible so decisions are not made on instinct.
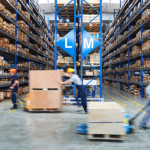
Warehouse Location Optimisation: Choosing Where Stock Should Live
Warehouse location work starts with one clear definition: service promise. Do customers need next-day delivery, two-day delivery, or delivery within a fixed appointment window? The tighter the promise, the more you may need stock closer to demand.
A practical model typically includes:
- Demand points (stores, pin codes, customer clusters) and volumes
- Candidate warehouse locations with fixed and variable costs
- Capacity constraints (space, labour availability, throughput)
- Service constraints (maximum distance or delivery time)
- Risk constraints (avoid single points of failure)
The methods range from simple to advanced. A “centre of gravity” approach gives a first approximation by balancing demand locations and volumes. More rigorous approaches use mathematical optimisation (often mixed-integer programming), which is simply a structured way to test many feasible network combinations and choose the lowest-cost one that meets constraints.
A useful angle many teams miss: the last mile changes everything. Even if regional linehaul routes are efficient, the final leg to the customer can dominate cost. One recent industry summary put last-mile delivery at 53% of total shipping costs, because it involves dispersed stops and low drop density. This is why businesses evaluate micro-fulfilment or dark stores in dense zones, while still using larger regional distribution centres for bulk replenishment.
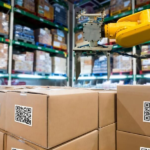
Distribution Route Optimisation: Turning Geography into a Daily Plan
Once facilities are set, routing determines day-to-day performance. Route optimisation usually means solving a “vehicle routing problem” (VRP): deciding which stops each vehicle serves, in what order, while respecting constraints such as:
- Vehicle capacity and loading compatibility
- Delivery time windows and driver hours
- Traffic patterns, tolls, and road restrictions
- Priority customers and cold-chain requirements
In plain English, routing is about reducing wasted kilometres without breaking service commitments. It can be static (planned weekly) or dynamic (updated with real-time traffic and order changes). For industries like FMCG distribution, pharma, and spare-parts logistics, better routing improves two business outcomes at once: lower cost-to-serve and fewer late deliveries.
It also interacts with warehouse placement. Adding a warehouse can shorten routes, but it may also add complexity: more transfer points, more linehaul moves between nodes, and more split shipments if inventory is not well coordinated.
What “Good” Looks Like: Scenario Thinking and Measurable Outcomes
Network optimisation is not a one-shot spreadsheet. It is a structured set of scenarios that decision-makers can debate with facts.
A disciplined approach usually includes:
- Baseline:current warehouses, current routes, current service levels
- Cost-first scenario:minimise cost while keeping service above a minimum
- Service-first scenario:hit a tighter delivery promise and quantify the cost increase
- Resilience scenario:test disruption (a warehouse down, a lane blocked, demand spikes)
Real-world case studies show that facility decisions can materially change transport costs. For instance, a published case analysis found a second facility could reduce transportation costs by roughly 19% to 26.7% across demand-growth scenarios (case-specific, but directionally useful).
For many professionals, this is where analytics becomes business value: turning network options into a recommendation with clear assumptions, risks, and KPIs. This is also why network optimisation features in a business analyst course—because the work sits between data, constraints, and executive trade-offs rather than inside one department.
Conclusion
Supply chain network optimisation is the discipline of deciding where warehouses should be and how goods should move so that cost, speed, and reliability stay in balance. The biggest insight is not a single formula; it is the visibility of trade-offs—transport versus inventory, speed versus cost, and efficiency versus resilience. The best teams treat network design as a living decision supported by scenarios, clean data, and measurable KPIs like cost-to-serve and on-time-in-full delivery. If you take away one principle, let it be this: make the network choices explicit, quantify the consequences, and revisit them as demand and service expectations evolve—the practical mindset reinforced in any solid business analysis course.
Business Name: Data Analytics Academy
Address: Landmark Tiwari Chai, Unit no. 902, 09th Floor, Ashok Premises, Old Nagardas Rd, Nicolas Wadi Rd, Mogra Village, Gundavali Gaothan, Andheri E, Mumbai, Maharashtra 400069, Phone: 095131 73654, Email: elevatedsda@gmail.com.
Happy
0 %
Sad
0 %
Excited
0 %
Sleepy
0 %
Angry
0 %
Surprise
0 %